Welcome Page
You are being invited to participate in a study titled "Visualization in Motion". This study is conducted by Lijie Yao and Petra Isenberg from Inria (France), and Anastasia Bezerianos from LISN (France).
The purpose of this study is to understand the accurate perception of data in moving charts. This experiment has two sections:
- a training section
- an experiment section
Please take part in this study only in case that you do not have problem with moving images on screens and do not have motion sensitivity (vestibular disorder).
The minimum screen size for this study is 13"3-inches. Normally most laptops (except the small Chromebooks, the old small MacBooks, and someother small-screen laptops) and desktops meet this requirement, however, all smartphones and most tablets will not meet the requirement.
The whole experiment will take you 17 minutes to complete. Please close unnecessary pages and reminders for the following 17 minutes. You will be compensated 2.55 GBP as long as you pass the calibration phase, pass the attention test trials, and complete the study.
Your participation in this study is entirely voluntary and you can withdraw at any time.
Please take part in this experiment only one time, if you have already completed it once, please leave the experiment. We will not pay for the participants who reload the page after finishing the calibration tool, so please do not reload the page during the experiment.
We thank you for your interest in participating in this study.
Please click the button below to proceed to the informed consent:
Consent Form
Calibration
Before we begin with the experiment we have to learn a little more about your screen. On the next couple of pages we will therefore have to go through a calibration step.
- Please make your browser window full screen and do not resize it anymore for the duration of the experiment.
- Please avoid distractions during the experiment for the next 17 minutes.


We are sorry, but you cannot continue the experiment
According to the calibration tool's result, that your screen size is not big enough to do our experiment.
We indicated at the beginning of the experiment that the minimum screen size is 13"3, and if your screen size cannot reach the study request, as we wrote in our consent form, you won't get paid.
You can close the window now and return the task on the Prolific platform.
Thank you for your interest in our online study.
Pre-questionnaire

Background Explanation
Imagine this scenario:
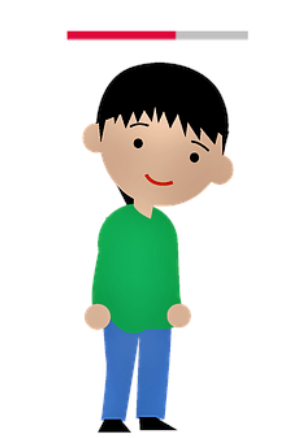
You are playing a video game where you control and move a character. The character starts out with full health but can lose health throughout the game. The character’s health state is displayed in a bar over its head. The red part indicates the character’s current health compared to how much health your character has already lost (in grey). We call this health indicator a bar chart.
- The bar has two sections, the red represents the current health and the grey represents lost health. The whole bar represents 100 percent of possible health.
- In the image on the left, your character is at 60% health and has lost 40% of its health (in grey).
Task Description
Here is an explanation of the types of questions you will have to answer in the study.
- You will always see a bar chart composed of two sections, one section is in red, and the other section in grey. For simplicity, there will be no character and no labels.


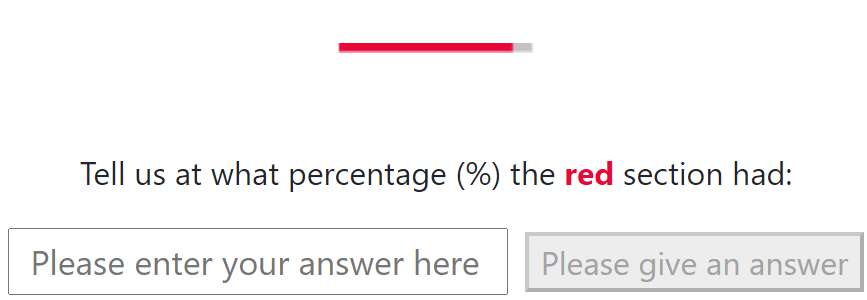
- You will be shown the same bar chart as before but the percentage (%) in red will vary each time.
- In this training, you will see the bar chart on the screen, it will display only 1 time.
- Only during training - each time you submit an answer we will tell you what the exact answer would have been. It is ok if you did not get the answer exactly correct, but you should be somewhere close.
- To pass this training, you need to get at least 6 of the questions correct.
- Again, make a quick but good guess of the right answer, but do not try to measure or calculate correct answers. We want to learn what numbers you intuitively see.
We are sorry, but you cannot continue the experiment
According to the previous answers, you have not passed the attention check. As we wrote in our consent form, you won't get paid.
The trials you failed were intentionally trivial to answer and your answers have not been in the acceptable and reasonable range of +/-10%. You failed 6 of these questions at this point.
For our research study to be valid, it is critical for us to get reliable data. To get reliable data, we need to make sure that our participants read all instructions and do our experiment seriously. Your answers to the previous attention check are an indication that you may not have paid full attention to all our trials.
Please feel free to contact the requester if you have any question or complaint.
Thank you for your interest in our online study.
Post-questionnaire
As the last step in this study please fill out a quick final questionnaire.
Thank you
You have finished the entire experiment, thank you so much for your participation!
Do you have any comment about the study, for example concerning the clarity of the instructions or technical issues you might have experienced? (optional)